PostGIS 筆記(五):將「點陣圖」儲存到資料庫裡面
PostGIS 所支援的點陣數據基於 GDAL 這個套件所支援的(列表)。
我們亦可利用這個指令來查閱支援的格式:
raster2pgsql -G
我們這次例子用到的是美國國家海洋和大氣管理局的全球預測模型解析度為 0.5 度的數值預報數據,我們可到這裡下載,利用 grib filter 下載我們想得到的數據,另外這裡亦有提供。
利用 grib filter 提供的連結,我們可得到 UTC 時間 2013 年 2 月 2 日 6 時發出的數據,我選取了 0, 24, 48 小時後接近地面的溫度和海平面氣壓:
wget "http://nomads.ncep.noaa.gov/cgi-bin/filter_gfs_hd.pl?file=gfs.t06z.mastergrb2f00&var_PRMSL=on&leftlon=0&rightlon=360&toplat=90&bottomlat=-90&dir=%2Fgfs.2013020206%2Fmaster" -O "2013020206f00msl.grib2"
wget "http://nomads.ncep.noaa.gov/cgi-bin/filter_gfs_hd.pl?file=gfs.t06z.mastergrb2f24&var_PRMSL=on&leftlon=0&rightlon=360&toplat=90&bottomlat=-90&dir=%2Fgfs.2013020206%2Fmaster" -O "2013020206f24msl.grib2"
wget "http://nomads.ncep.noaa.gov/cgi-bin/filter_gfs_hd.pl?file=gfs.t06z.mastergrb2f48&var_PRMSL=on&leftlon=0&rightlon=360&toplat=90&bottomlat=-90&dir=%2Fgfs.2013020206%2Fmaster" -O "2013020206f48msl.grib2"
wget "http://nomads.ncep.noaa.gov/cgi-bin/filter_gfs_hd.pl?file=gfs.t06z.mastergrb2f00&lev_2_m_above_ground=on&var_TMP=on&leftlon=0&rightlon=360&toplat=90&bottomlat=-90&dir=%2Fgfs.2013020206%2Fmaster" -O "2013020206f00tmp.grib2"
wget "http://nomads.ncep.noaa.gov/cgi-bin/filter_gfs_hd.pl?file=gfs.t06z.mastergrb2f24&lev_2_m_above_ground=on&var_TMP=on&leftlon=0&rightlon=360&toplat=90&bottomlat=-90&dir=%2Fgfs.2013020206%2Fmaster" -O "2013020206f24tmp.grib2"
wget "http://nomads.ncep.noaa.gov/cgi-bin/filter_gfs_hd.pl?file=gfs.t06z.mastergrb2f48&lev_2_m_above_ground=on&var_TMP=on&leftlon=0&rightlon=360&toplat=90&bottomlat=-90&dir=%2Fgfs.2013020206%2Fmaster" -O "2013020206f48tmp.grib2"
利用 raster2pgsql 匯入到資料庫:
raster2pgsql -s 4326 -I -b 1 -C -M 2013020206f00msl.grib2 grib_raster_test_msl00 |  psql -U user -d template_postgis
raster2pgsql -s 4326 -I -b 1 -C -M 2013020206f24msl.grib2 grib_raster_test_msl24 |  psql -U user -d template_postgis
raster2pgsql -s 4326 -I -b 1 -C -M 2013020206f48msl.grib2 grib_raster_test_msl48 |  psql -U user -d template_postgis
raster2pgsql -s 4326 -I -b 1 -C -M 2013020206f00tmp.grib2 grib_raster_test_tmp00 |  psql -U user -d template_postgis
raster2pgsql -s 4326 -I -b 1 -C -M 2013020206f24tmp.grib2 grib_raster_test_tmp24 |  psql -U user -d template_postgis
raster2pgsql -s 4326 -I -b 1 -C -M 2013020206f48tmp.grib2 grib_raster_test_tmp48 |  psql -U user -d template_postgis
然後我們便可以利用 SQL 來查閱數據,例如大埔於香港時間 2013 年 2 月 2 / 3 / 4 日 14 時的溫度和海平面氣壓:
template_postgis=# SELECT 0 AS time, ST_Value (rast, ST_PointFromText('POINT(114.1689 22.4518)', 4326)) As temperature from grib_raster_test_tmp00 UNION
SELECT 24 AS time, ST_Value (rast, ST_PointFromText('POINT(114.1689 22.4518)', 4326)) As temperature from grib_raster_test_tmp24 UNION
SELECT 48 AS time, ST_Value (rast, ST_PointFromText('POINT(114.1689 22.4518)', 4326)) As temperature from grib_raster_test_tmp48;

 time |   temperature
------+------------------
    0 | 24.8200012207031
   24 | 20.0199829101563
   48 |             22.6
(3 rows)


template_postgis=# SELECT 0 AS time, ST_Value (rast, ST_PointFromText('POINT(114.1689 22.4518)', 4326))/100 As msl from grib_raster_test_msl00 UNION
SELECT 24 AS time, ST_Value (rast, ST_PointFromText('POINT(114.1689 22.4518)', 4326))/100 As msl from grib_raster_test_msl24 UNION
SELECT 48 AS time, ST_Value (rast, ST_PointFromText('POINT(114.1689 22.4518)', 4326))/100 As msl from grib_raster_test_msl48;

 time |      msl
------+----------------
   48 | 1016.697890625
   24 | 1017.906171875
    0 | 1018.010703125
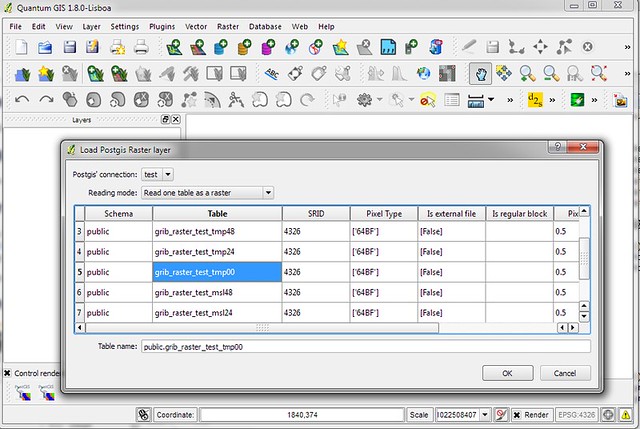
我們亦可利用 GIS 軟件來讀取,例如 Quantum GIS,利用 Load Postgis Raster to QGIS 這擴展去讀取資料庫內,溫度的分佈:
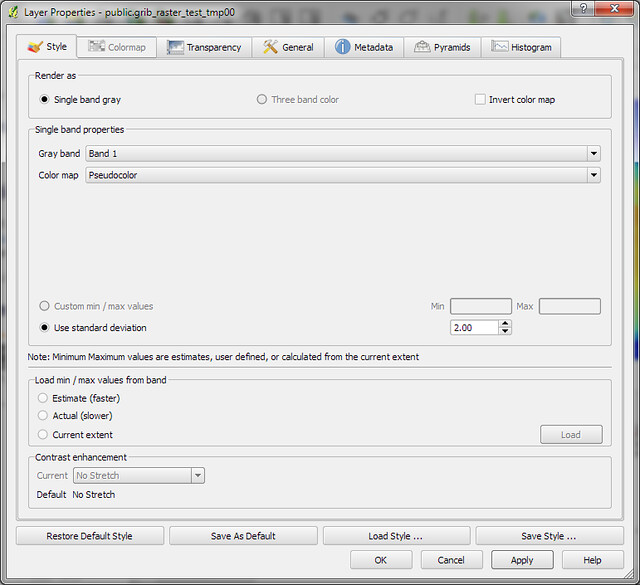
選取顏色分佈:
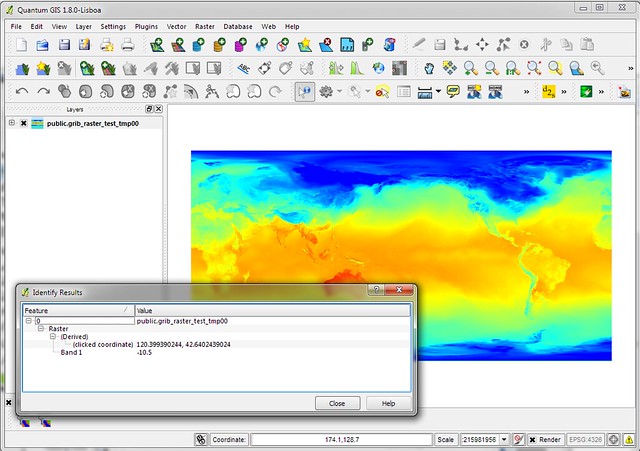
也可點選結果:
PostGIS 也提供了好些函數處理 Raster,可參考這裡。
除了利用 PostgreSQL,其實 GDAL 這套軟件集也提供了一些命令行工具供用戶查閱 Raster 上的資料和數據,更多資料可查閱這裡:
user@postgis:~$ gdalinfo 2013020206f48msl.grib2
Driver: GRIB/GRIdded Binary (.grb)
Files: 2013020206f48msl.grib2
Size is 720, 361
Coordinate System is:
GEOGCS["Coordinate System imported from GRIB file",
    DATUM["unknown",
        SPHEROID["Sphere",6371229,0]],
    PRIMEM["Greenwich",0],
    UNIT["degree",0.0174532925199433]]
Origin = (-0.250000000000000,90.250000000000000)
Pixel Size = (0.500000000000000,-0.500000000000000)
Corner Coordinates:
Upper Left  (  -0.2500000,  90.2500000) (  0d15' 0.00"W, 90d15' 0.00"N)
Lower Left  (  -0.2500000, -90.2500000) (  0d15' 0.00"W, 90d15' 0.00"S)
Upper Right (     359.750,      90.250) (359d45' 0.00"E, 90d15' 0.00"N)
Lower Right (     359.750,     -90.250) (359d45' 0.00"E, 90d15' 0.00"S)
Center      ( 179.7500000,   0.0000000) (179d45' 0.00"E,  0d 0' 0.01"N)
Band 1 Block=720x1 Type=Float64, ColorInterp=Undefined
  Description = 0[-] MSL="Mean sea level"
  Metadata:
    GRIB_COMMENT=Pressure reduced to MSL [Pa]
    GRIB_ELEMENT=PRMSL
    GRIB_FORECAST_SECONDS=172800 sec
    GRIB_PDS_PDTN=0
    GRIB_PDS_TEMPLATE_NUMBERS=3 1 2 0 96 0 0 0 1 0 0 0 48 101 0 0 0 0 0 255 0 0 0 0 0
    GRIB_REF_TIME=  1359784800 sec UTC
    GRIB_SHORT_NAME=0-MSL
    GRIB_UNIT=[Pa]
    GRIB_VALID_TIME=  1359957600 sec UTC
user@postgis:~$ gdallocationinfo -wgs84 2013020206f00tmp.grib2 114.1689 22.4518
Report:
  Location: (228P,135L)
  Band 1:
    Value: 24.8200012207031
參考資料:
Chapter 5. Raster Data Management, Queries, and Applications
Chapter 9. Raster Reference
gis.stackexchange.com - grib2 to raster? (grib2 -> raster2pgsql -> PostGIS 2.0 -> GeoServer)
其他有關氣象數據的內部連結:
NetCDF Java Library example
NetCDF Java Library example - dump table
NetCDF Java Library - dump to SQLite
NetCDF Java Library - dump to JSON (Draft)
製圖實驗
Experiment for fetching OPeNDAP data
ncl 製圖
安裝及使用 NCL,以 GFS 的氣壓初始場及對 Δp(972) 及 Δp(S) 的預測為例
第一次運行 WRF 數值天氣預報模式,但明顯失敗
內部連結:
【目錄】地理/地理資訊系統/空間資料庫/大地測量內部連結
本文連結